Key Takeaways Bollinger Bands একটি জনপ্রিয় Technical Indicator, যা Asset-এর Volatility এবং সম্ভাব্য Overbought/Oversold Condition বোঝাতে সাহায্য করে। Price যদি Upper Band-এর কাছে যায়, তাহলে Overbought ধরা হতে পারে, আর Lower Band-এর কাছে এলে...

Management Analysis শেখার সহজ উপায়
📊 Management Analysis কী? কীভাবে বুঝবেন ভালো Management? 👉🏻 বিস্তারিত জানতে দেখে নিন আমাদের এই পোস্টটি। #Management_Analysis #Skills_Experience #How_To_Conduct...

Management Analysis Explained Simply
📊 What is Management Analysis? How do you identify good management? 👉🏻 Check out our post to learn more....

একটি ছোট Candlestick-এই বড় Reversal — কিভাবে?
Key Takeaways Hammer Candlestick একটি Bullish Reversal Pattern, যেখানে উপরে ছোট Body এবং নিচে লম্বা Lower Shadow থাকে। এটি...
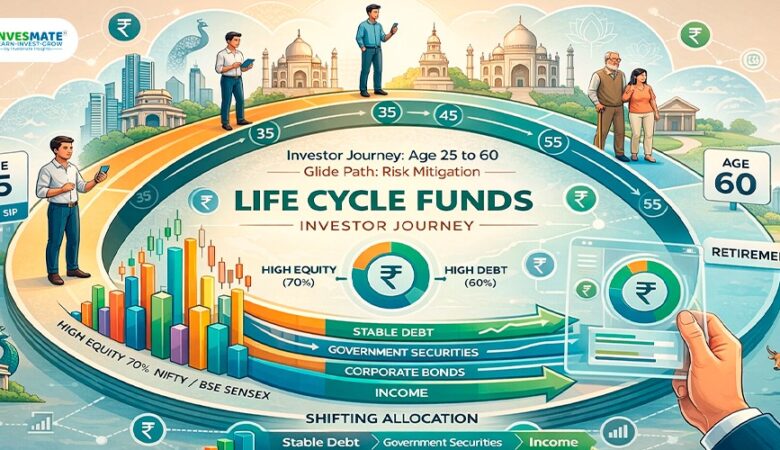
Long-Term Investing সহজ করার নতুন উপায়
ফেব্রুয়ারি 2026-এ ভারতের Capital Market Regulator Securities and Exchange Board of India (SEBI) একটি নতুন Category-এর Mutual Fund Scheme...

SEBI নতুন Mutual Fund Rules Announce করেছে
🔰Mutual Fund-এ বড় পরিবর্তন আনল SEBI❗ 🌀কি সেই পরিবর্তন❓ 👉🏻বিস্তারিত জানতে দেখে নিন আমাদের এই পোস্টটি। #SEBI_RULES #EQUITY_ALLOCATION #PORTFOLIO_RULE...

SEBI Announces New Mutual Fund Rules
🔰SEBI Brings Major Changes to Mutual Funds❗ 🌀What are these changes ❓ 👉🏻Find out in detail through this post....

Iran–US Conflict: এক সপ্তাহে Indian Stock Market-এ কী প্রভাব পড়লো?
2026 সালের ফেব্রুয়ারির শেষ সপ্তাহে Middle East-এ বড় একটি Geopolitical Development দেখা যায় যখন United States এবং তার Allies...
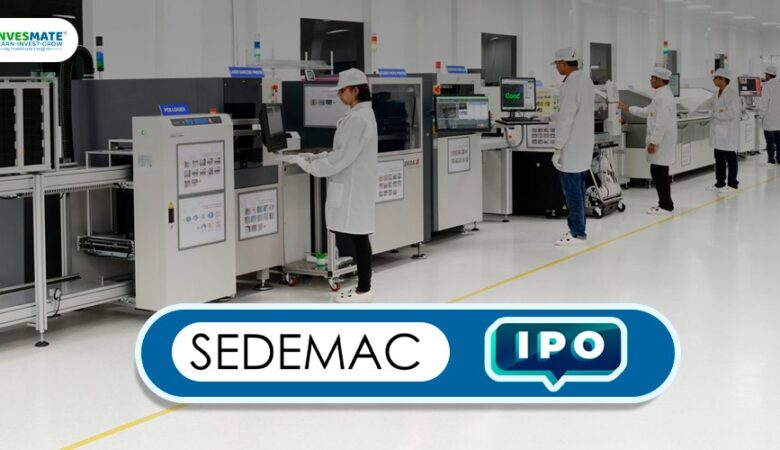
Sedemac Mechatronics-এর IPO Analysis: ভারতের Control-Intensive Automotive Electronics কোম্পানিটির প্রয়োজনীয় সব তথ্য
যখন একটি Two-Wheeler Manufacturer Strict Bharat Stage 6 Emission Norms মেনে এবং On-Board Diagnostics System যুক্ত Engine Platform বাজারে...

MoU: Corporate Deal Secure করার প্রথম পদক্ষেপ
আজকের Partnership, Collaboration এবং Joint Venture-Dependent Business Condition-এ Trust ও Clarity অত্যন্ত গুরুত্বপূর্ণ। একটি Legally Binding Contract সই করার...

2026 সালের Superstar Investor Portfolio
🔰 মার্কেটে Volatility থাকলেও বড় বিনিয়োগকারীরা Panic করছেন না। বরং তারা তাদের পছন্দের স্টক এখনো Hold করে রেখেছেন। 📊...