Technical Analysis is the art of using Historical price data and Patterns to make informed trading decisions. Whether you’re a seasoned trader or just starting out, understanding these tools can significantly enhance your trading skills.
Let’s explore the market top five Technical Analysis tools that every stock market enthusiast should know:
What is a Technical Analysis Tool?
A Technical Analysis tool is an instrument used by Traders and Investors to evaluate and predict future price movements in financial markets.
Unlike Fundamental Analysis, Fundamental Analysis looks at a company’s financial health and economic factors, but Technical Analysis focuses on historical price data, volume and other market statistics.
How Technical Analysis Tools and Techniques Help Traders ?
Technical Analysis tools and techniques provide traders with a systematic approach to understanding market behaviour. Such as–
- Identify Trends: Uptrend, Downtrend or Sideways Trend detection and comparison.
- Predict Price Movements: Use patterns and indicators to forecast future price directions.
- Determine Entry and Exit Points: Pinpoint optimal moments to buy or sell securities to maximize profits and minimize losses.
- Assess Market Strength: Evaluate the strength of a trend and the potential for continuation or reversal.
- Manage Risk: Implement stop-loss orders and other risk management strategies based on technical signals.
Top 5 Technical Analysis Tools for Stock Market
1. Moving Average
The Moving Average is one of the most time-tested tools used in trading. This indicator identifies the trend direction of a stock based on historical prices and generates buy and sell signals.
Moving Averages primarily have two categories: Simple Moving Average (SMA), Exponential Moving Average (EMA)
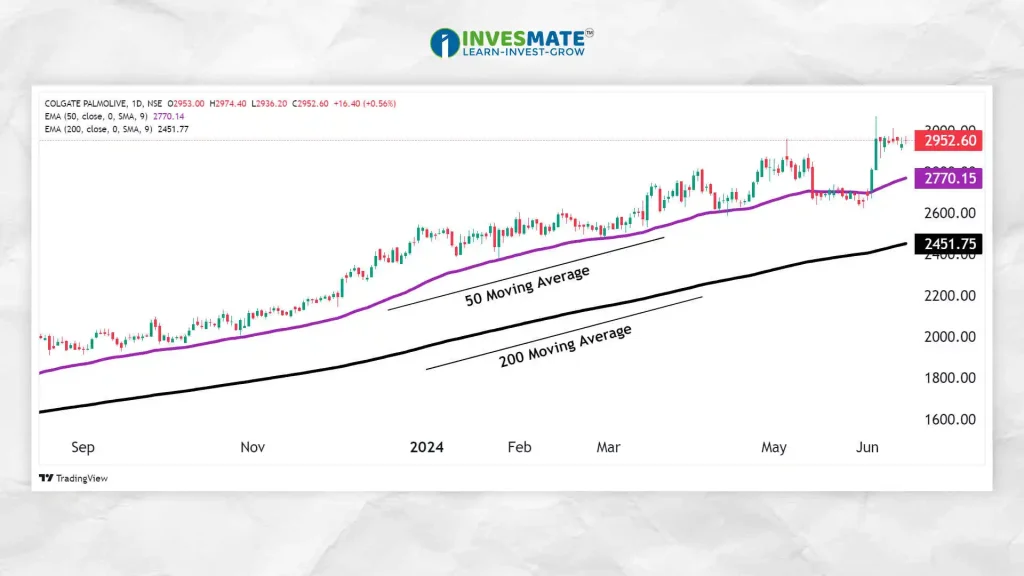
- How it Works: The Moving Average (MA) calculates the average of past prices over a time period (e.g., 50 days or 200 days) and plots it on the chart.
- Usage: The Moving Average helps traders gain a clearer understanding of market trends. When the moving average is rising, it indicates a market uptrend. Conversely, when the moving average is falling, it indicates a downtrend in the market.
- Advantages: Helps to filter out noise from random price fluctuations and provides a clear direction of the trend.
2. Bollinger Bands
A Bollinger Bands is a Technical Analysis tool used to measure volatility and identify potential price levels relative to a security’s recent price history. It consists of three bands:
Upper Band: Placed two standard deviations above the middle band, this line represents a potential Overbought zone.
Upper Band = 20-day SMA + (20-day Standard Deviation x 2)
Middle Band: This is usually the 20-Day Simple Moving Average (SMA), which is used as the Baseline.
Middle Band = 20-day SMA.
Lower Band: Placed two standard deviations below the middle band, this line indicates a potential Oversold zone.
Lower Band = 20-day SMA – (20-day Standard Deviation x 2)
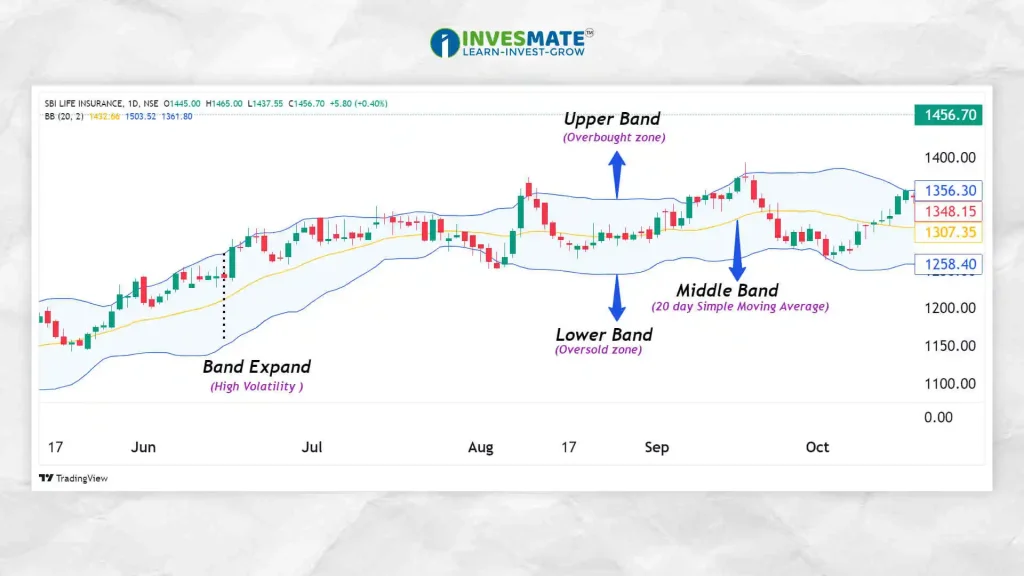
- How it Works: The bands expand based on market volatility. When the bands are close together, it indicates low volatility, and when they are wide apart, it suggests high volatility.
- Usage: Traders use Bollinger Bands to identify Overbought and Oversold conditions. When the price touches the Upper band, it indicates that the asset may be in an Overbought zone, and when it touches the Lower band, it indicates that the asset may be in an Oversold zone.
- Advantages: It Provides a visual representation of volatility and potential price reversals.
3. Fibonacci Retracement
Fibonacci Retracement is a tool based on the key numbers identified by Mathematician Leonardo Fibonacci. It is used to identify potential Support and Resistance levels.
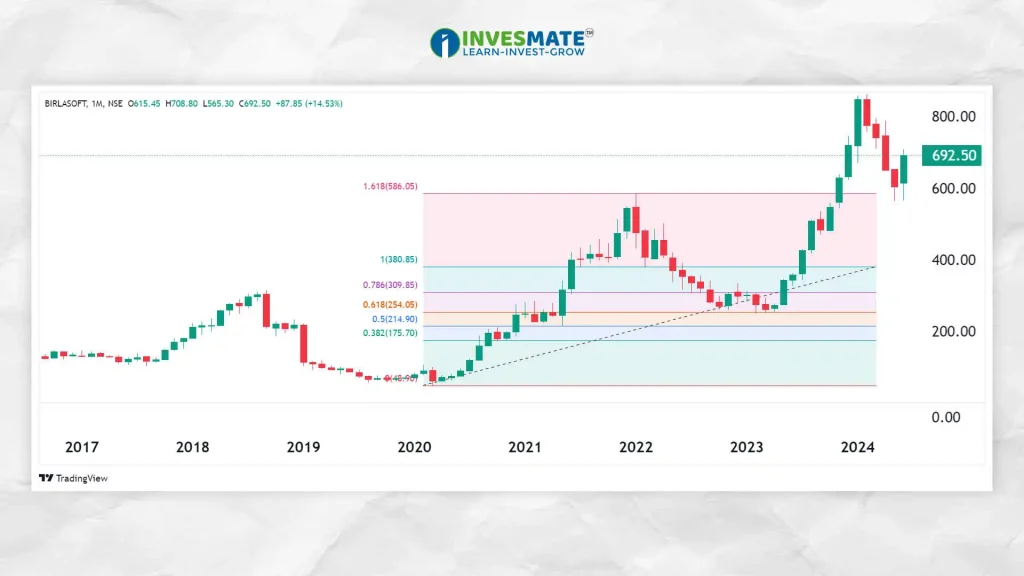
- How it Works: Traders draw horizontal lines on a chart at key Fibonacci levels (38.2%, 50%, and 61.8%) to identify potential retracement points.
- Usage: When a stock is trending, it often retraces to one of the Fibonacci levels before continuing in the original direction. Traders use these levels to enter or exit trades.
**Note:The most commonly used ratios include 0.382, 0.5, and 0.618.
- Advantages: It helps traders predict potential reversal points with a high degree of accuracy.
4. Relative Strength Index (RSI)
The Relative Strength Index (RSI) is a momentum indicator in technical analysis, measuring recent price changes to assess Overvalued or Undervalued conditions. It ranges from 0 to 100.
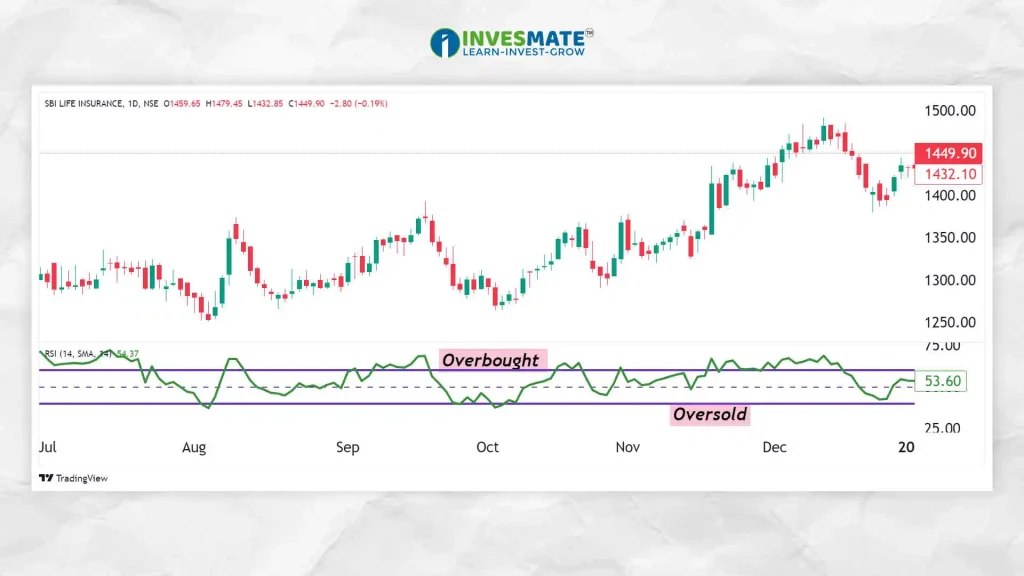
- How it Works: RSI is calculated using average profit and loss calculations over a specific period of time, usually 14 days. When RSI is above 60, it indicates that the asset is Overvalued; Conversely, when RSI is below 40, it indicates that the asset is Undervalued.
- Usage: Traders use RSI to identify Overvalue or Undervalue conditions, which can signal potential reversals. It can also be used to confirm the strength of a trend.
- Advantages: The Relative Strength Index (RSI) provides a clear indication of market conditions and potential turning points.
5. Moving Average Convergence Divergence (MACD)
The Moving Average Convergence Divergence (MACD) is a trend-following momentum indicator that shows the relationship between two Moving Averages of a security’s price.
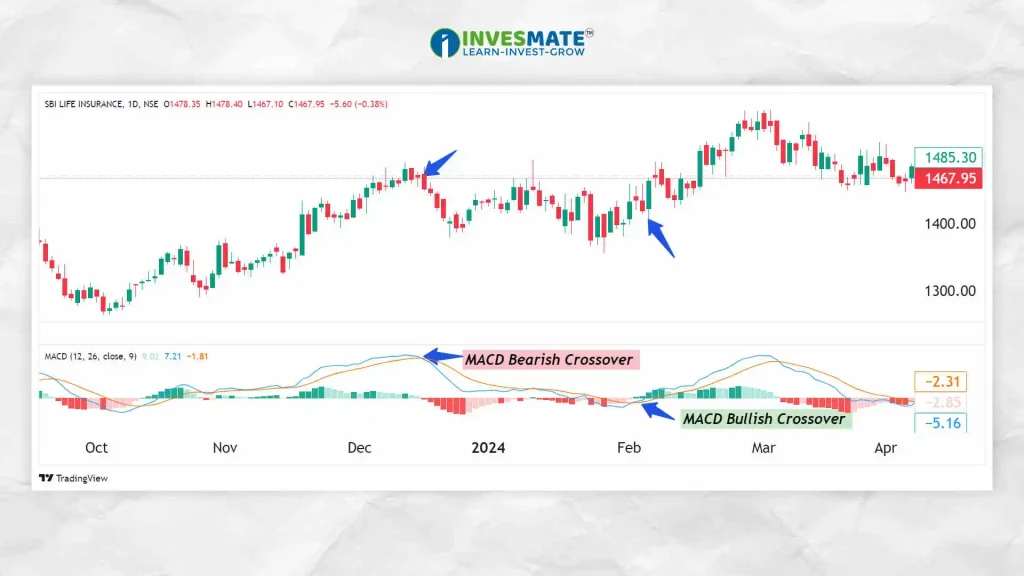
- How it Works: The MACD is calculated by subtracting the 26-period EMA from the 12-period EMA. A 9-day EMA of the MACD, called the signal line, is then plotted on top of the MACD line.
- Usage: Traders look for Crossovers, Divergences, and Periods of Strong momentum. A Bullish Signal occurs when the MACD line Crosses above the signal line, and a Bearish Signal occurs when it Crosses below.
- Advantages: It integrates trend and momentum into a unified indicator, offering thorough market insights.
Conclusion :
Technical analysis tools are essential for traders aiming to make well-informed decisions in the stock market. By utilizing tools such as Moving Averages, Bollinger Bands, Fibonacci Retracement, RSI, and MACD, traders can develop a profound insight into market trends, forecast price fluctuations, and refine their trading strategies. Whether you are new to trading or an experienced investor, mastering these tools can greatly enhance your prospects for success in financial markets.
Disclaimer :
This article is for information only, not financial advice. Trading and investing in the share market involves risk and past performance does not indicate future results. Readers should do their own research and consult a qualified financial advisor before making any investment decision.
FAQs
The best tool to analyze stocks often depends on individual preferences and trading strategies. However, widely regarded tools include Moving Averages, Relative Strength Index (RSI), Bollinger Bands, and MACD.
Both Technical and Fundamental Analysis are important. Technical Analysis is best for short-term trading and identifying market trends and entry/exit points. Fundamental Analysis is good for Long Term Investing.
The Moving Average is one of the most widely used technical analysis tools.
A combination of different tools is best for trading. For example, using Moving Average for trend identification, RSI for understanding momentum, and MACD for detecting trend changes provides a holistic view.
এই তথ্য শুধুমাত্র শিক্ষামূলক উদ্দেশ্যে প্রদান করা হয়েছে। একে কোনোভাবেই Investment Advice বা Recommendation হিসেবে গণ্য করা উচিত নয়। আমরা একটি SEBI-registered Organization, এবং আমাদের মূল লক্ষ্য হলো বিনিয়োগ সম্পর্কিত Concepts-এর সাধারণ জ্ঞান ও বোঝাপড়া বৃদ্ধি করা।
প্রত্যেক পাঠক/দর্শককে অনুরোধ করা হচ্ছে, যেকোনো Investment Decision নেওয়ার আগে নিজস্ব Research এবং Analysis করুন। Investment সর্বদা হওয়া উচিত ব্যক্তিগত Conviction-এর ভিত্তিতে, অন্যের মতামত থেকে নয়। অতএব, প্রদত্ত তথ্যের ওপর ভিত্তি করে নেওয়া কোনো ধরনের Investment Decision-এর জন্য আমরা কোনোভাবেই Liability বা Responsibility গ্রহণ করি না।


Leave a Reply