Single Candlestick Patterns are easy and effective tools that provide clear insights into market trends and potential reversals. Mastering patterns like the Doji or Hammer can significantly enhance your trading strategy, enabling you to make confident decisions.
You may go through the blog: “Beginners Guide To Candlestick Chart Patterns In 2024″ to know basic candlestick patterns.
In this blog, we’ll learn how to improve trading and investment strategies. So let’s get started.
Single Candlestick Patterns :
A single candlestick pattern is formed by just one candle using the open, close, high, and low prices of a single trading period. Traders often use single candlestick patterns to gauge the immediate sentiment of buyers and sellers and make informed trading decisions.
What Does a Single Candlestick Pattern Indicate?
A single candlestick pattern indicates the immediate sentiment of buyers and sellers within a specific trading period, helping traders gauge potential market direction.
Types Of Single Candlestick Pattern :
Doji Candlestick :
Doji Candlestick indicates market indecision with nearly equal opening and closing prices, while the candle forms a small-body with a long upper and lower shadow.
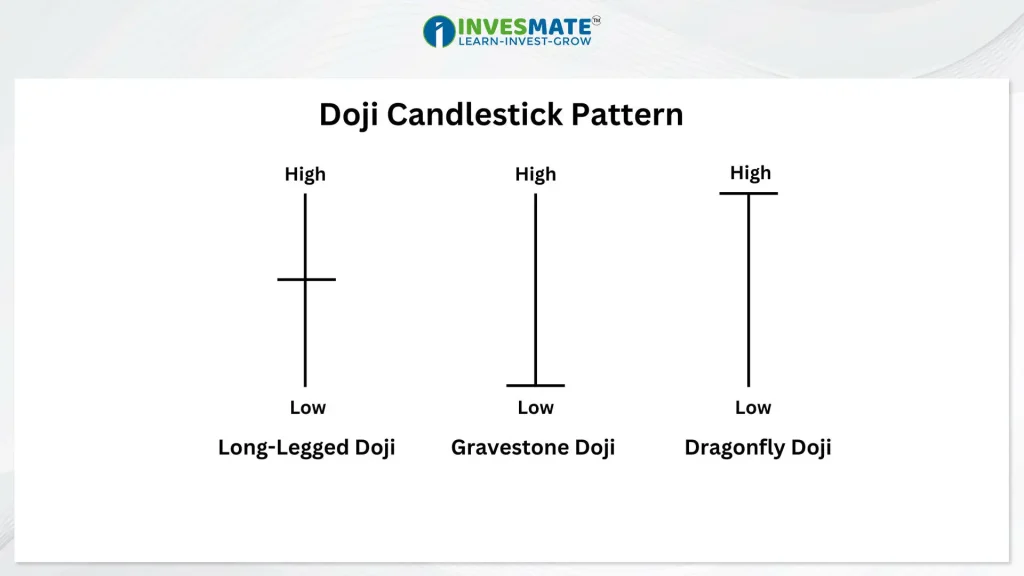
Doji Candlestick Features :
Small Body: Indicates minimal price difference between opening and closing prices.
Long Upper and Lower Shadows: Signifies significant price movement, but ultimately the price closes near the opening.
Indecision: Reflects uncertainty among traders, often observed during consolidation periods.
Variations: Includes Long-Legged Doji Gravestone Doji and Dragonfly Doji, each with nuanced implications for market sentiment and potential price movements.
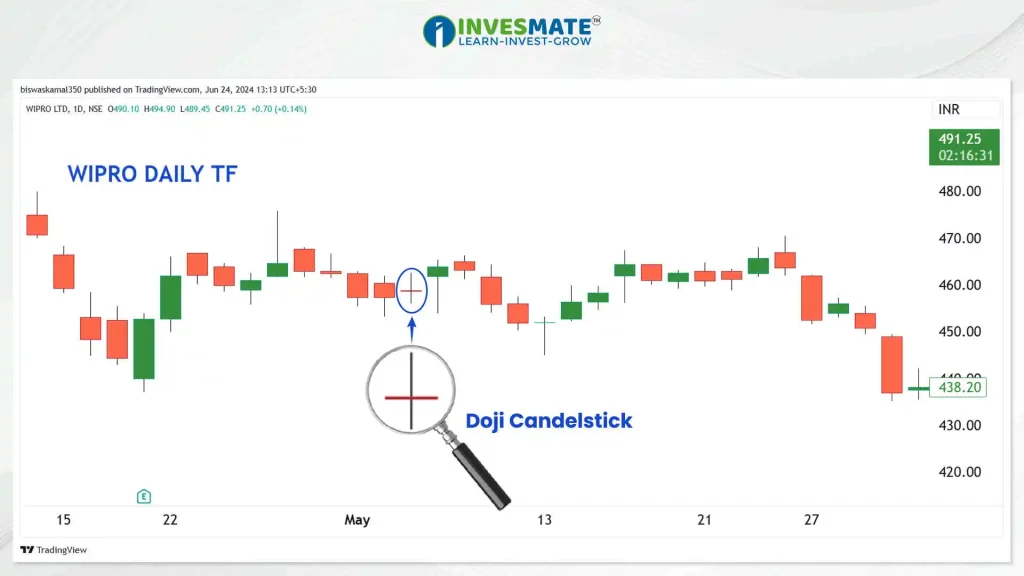
Here’s an illustration of how a Doji Candlestick functions.
Hammer Candlestick :
A hammer is a candlestick pattern signalling potential trend reversal. It forms when the price drops significantly after opening but rallies to close near or above the opening price.
A hammer candlestick has a small body near the top of the candlestick’s range and a long lower wick. It suggests that sellers were initially in control but lost steam, indicating a potential bullish reversal.
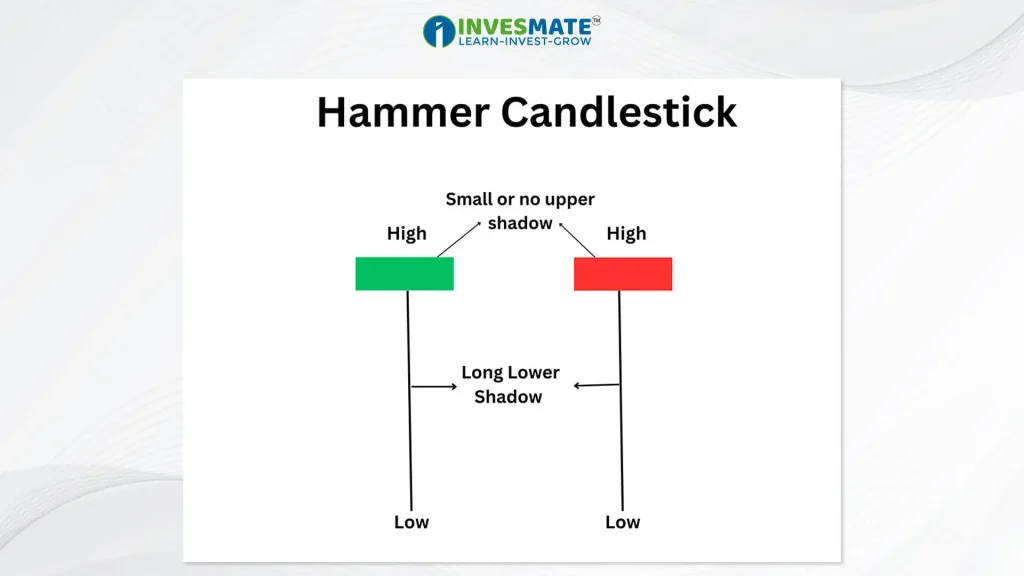
Hammer Candlestick Features :
Long lower wick: Indicates intra-period price low, suggesting seller pressure followed by buyers resurgence.
Short body: Near the candle’s top, indicating minimal price movement between the opening and closing.
Upper shadow: Failed upward momentum can appear in various forms.
Volume: Ideally high, indicating strong conviction for reversal.
Location: Effective after downtrends, especially at key support levels.
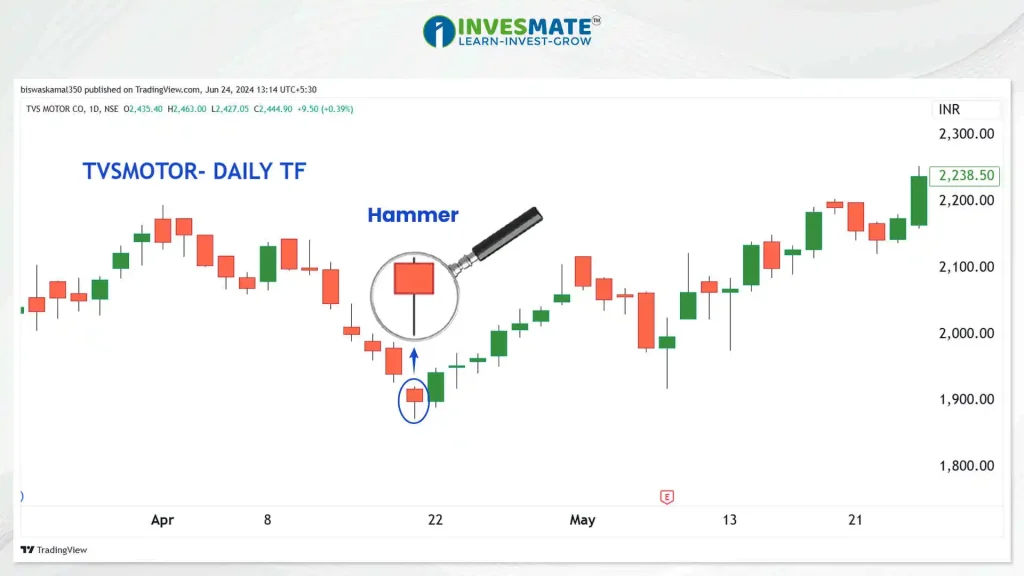
Here’s an illustration of how a Hammer functions.
Inverted Hammer Candlestick :
The Inverted Hammer candlestick pattern signals a potential uptrend reversal. It forms when the price opens, then drops significantly during the period, but closes near or above the opening price.
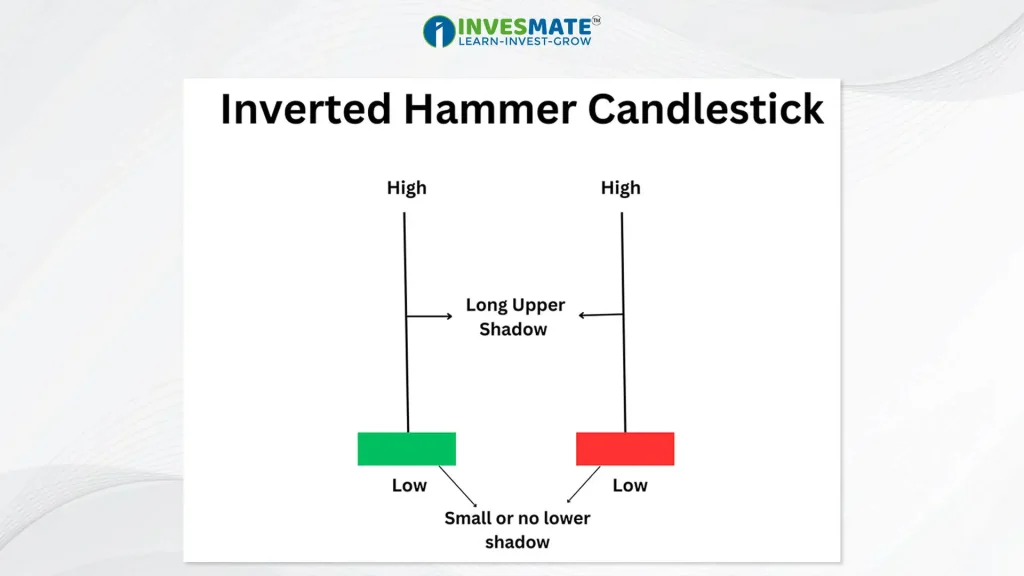
Inverted Hammer Candlestick Features :
Long upper shadow: Initial bullish momentum provides guidance after the arrival of selling pressure.
Small/no lower shadow: Shows little or no movement at the bottom.
Short body: Near or at bottom, closing near or below opening.
Volume: Higher volume strengthens the pattern, indicating stronger selling.
Location: The end of the Downtrend is relatively significant, signaling a possible reversal.
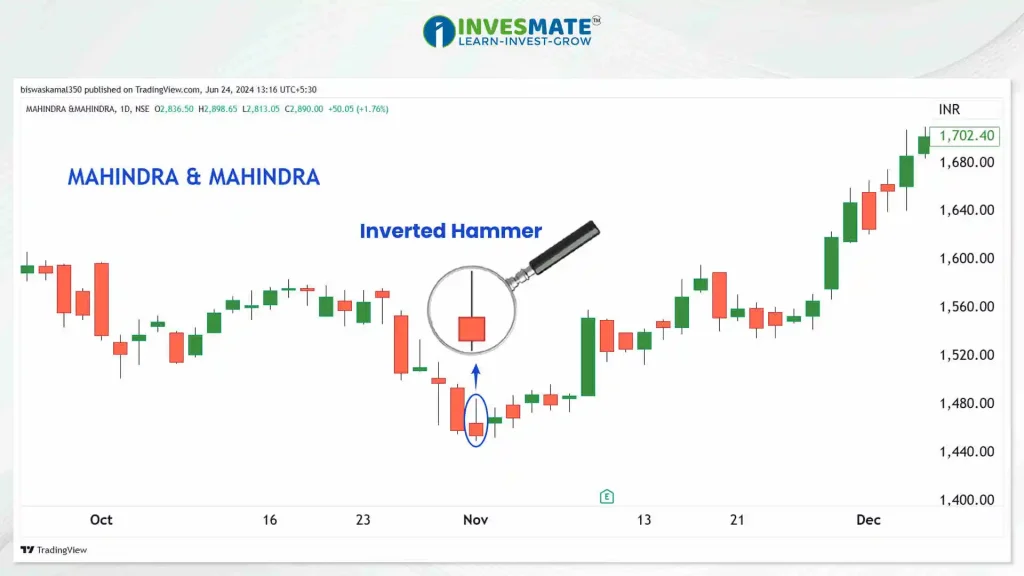
Here’s an illustration of how a Inverted Hammer functions.
Spinning Top Candlestick :
The Spinning Top candlestick indicates market indecision. It forms with close opening and closing prices and long upper and lower shadows.
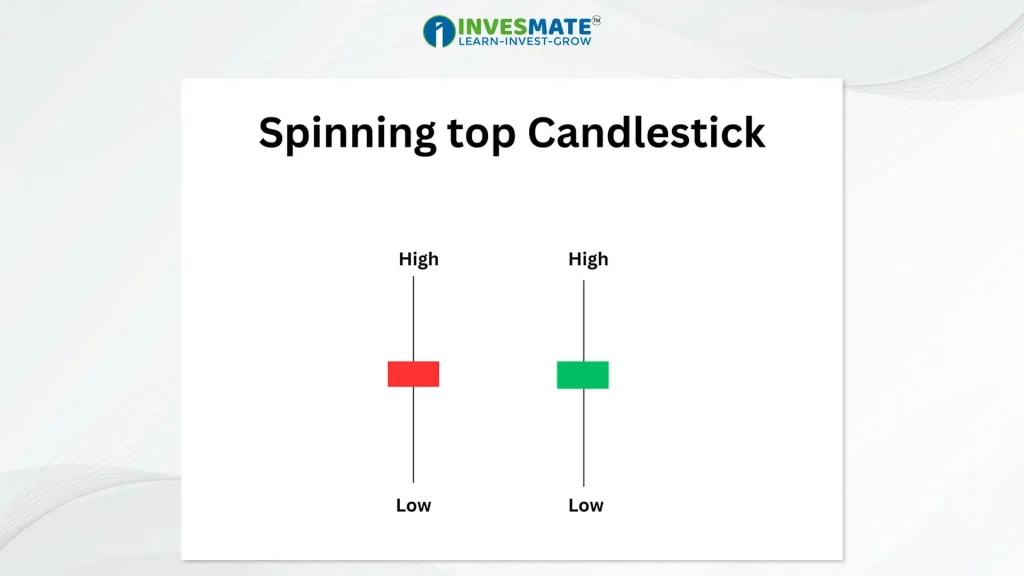
Spinning Top Candlestick Features :
Small body: Signifies minimal price movement between opening and closing.
Long upper and lower shadows: Reflect market’s attempts to move in both directions.
Indecision: Close near open implies uncertainty.
Volume: Average, showing lack of strong conviction.
Context: Most significant after significant price movements, suggesting potential pause or reversal.
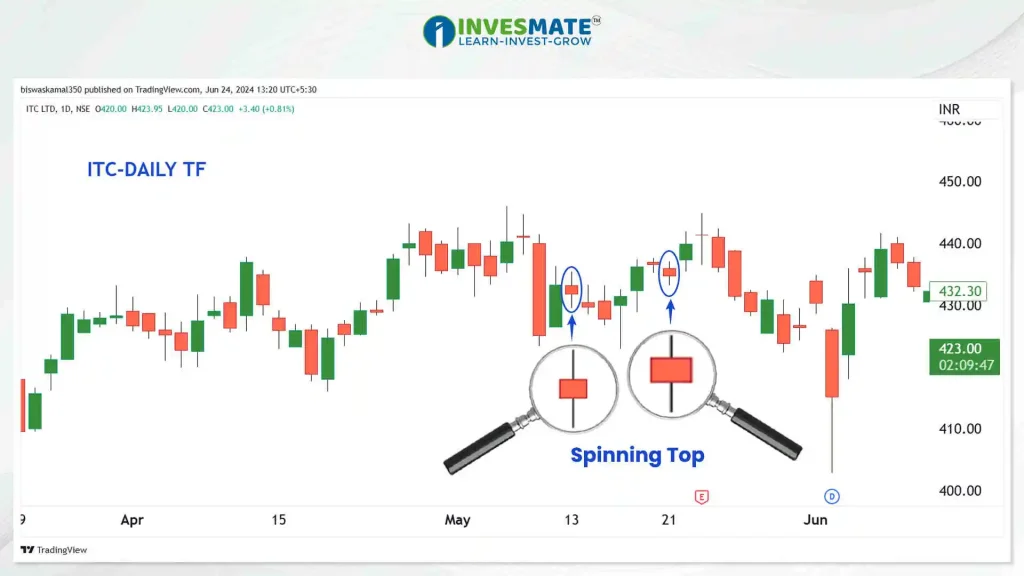
Here’s an illustration of how a Spinning Top Candlestick functions.
Marubozu Candlestick :
The Marubozu candlestick signifies strong buying or selling pressure. It forms with a long body and little to no shadow.
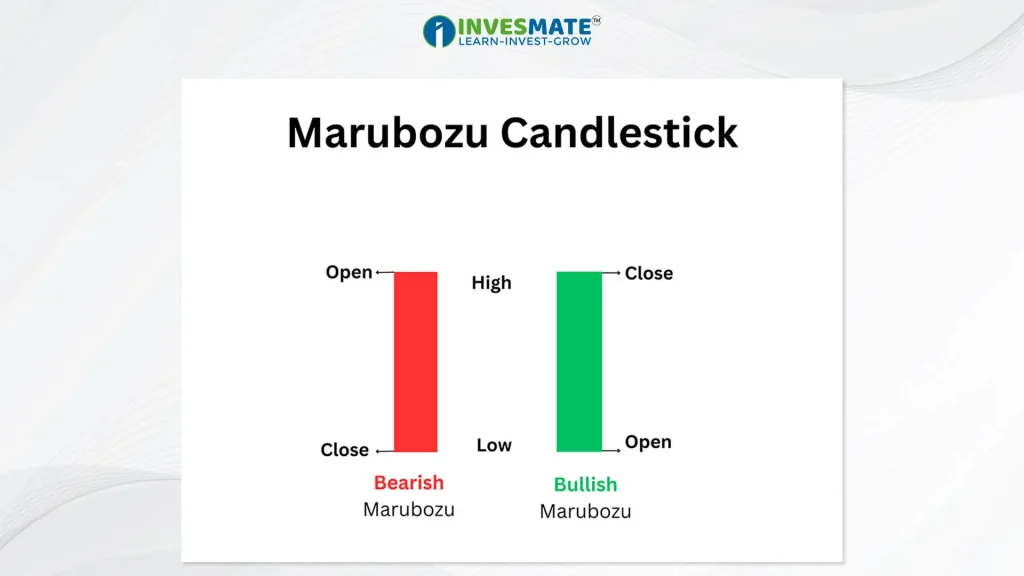
Marubozu Candlestick Features :
Long body: Represents significant price movement from open to close.
Little/no shadow: Indicates opening/closing price near high/low.
Bullish Marubozu: Closing price significantly higher than opening, showing strong buying.
Bearish Marubozu: Closing price significantly lower than opening, indicating strong selling.
Volume: High volume confirms strength of buying or selling.
Context: Significant within trends, signalling either trend continuation or potential reversal.
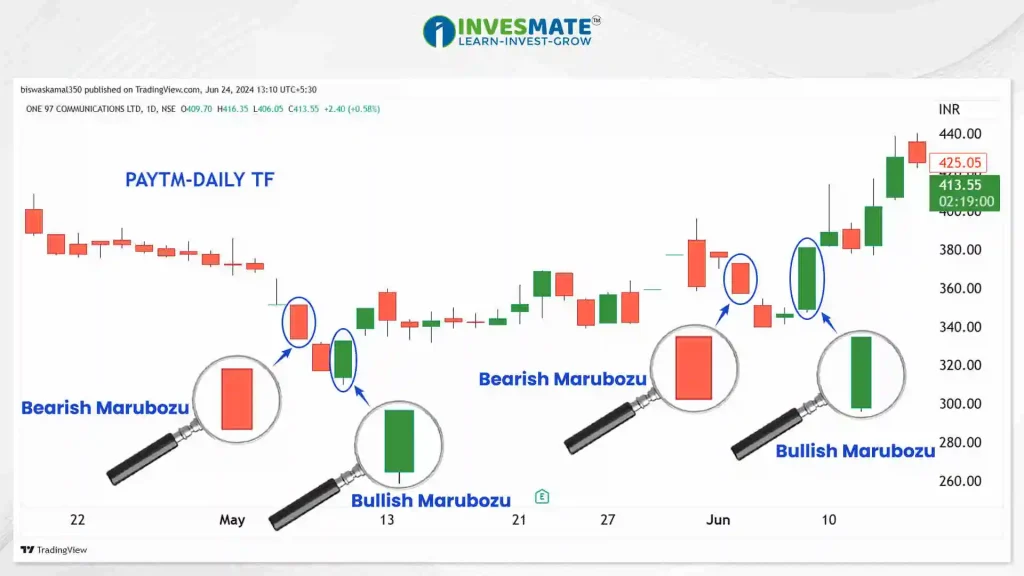
Here’s an illustration of how a Marubozu Candlestick functions.
Shooting Star Candlestick :
The Shooting Star has a small body near the bottom of the candlestick’s range and a long upper wick. It forms at the peak of an uptrend and suggests a potential reversal, with sellers gaining momentum.
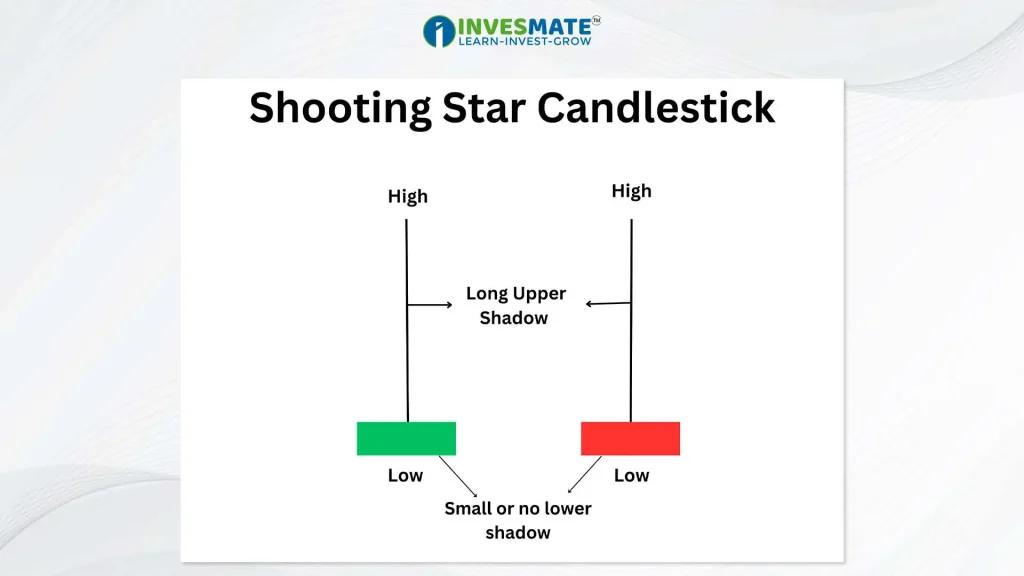
Shooting Star Candlestick Features :
Small body: Indicates little price change between open and close.
Long Upper Shadow: Indicates an unsuccessful attempt to push prices higher during the trading period.
Short/no lower shadow: Indicates limited downward movement.
Volume: Higher volume strengthens pattern.
Location: More significant after strong uptrend, signalling potential reversal to bearish trend.
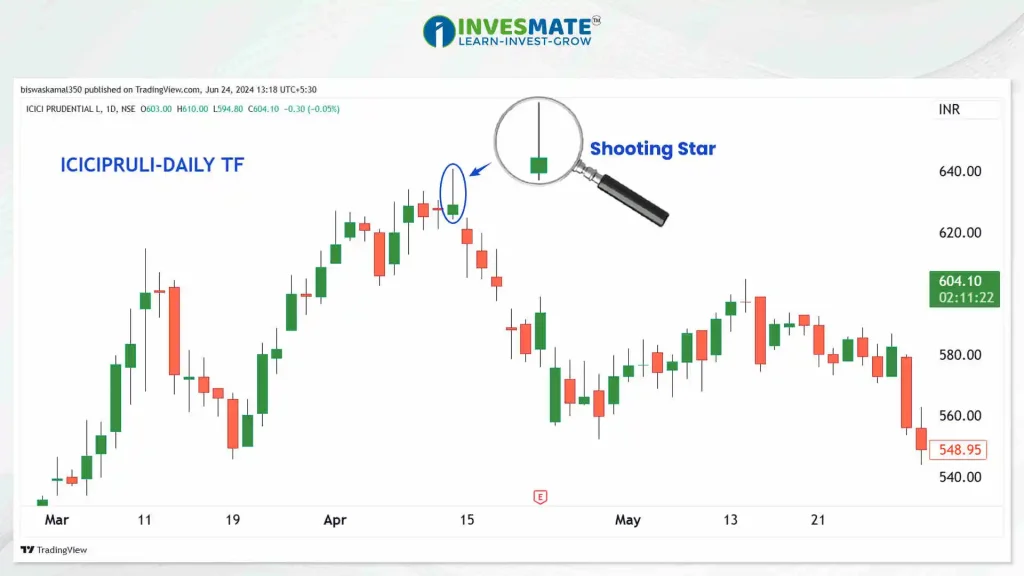
Here’s an illustration of how a Shooting Star Candlestick functions.
Hanging Man Candlestick :
The Hanging Man candlestick is a bearish reversal pattern that forms at the end of an uptrend.
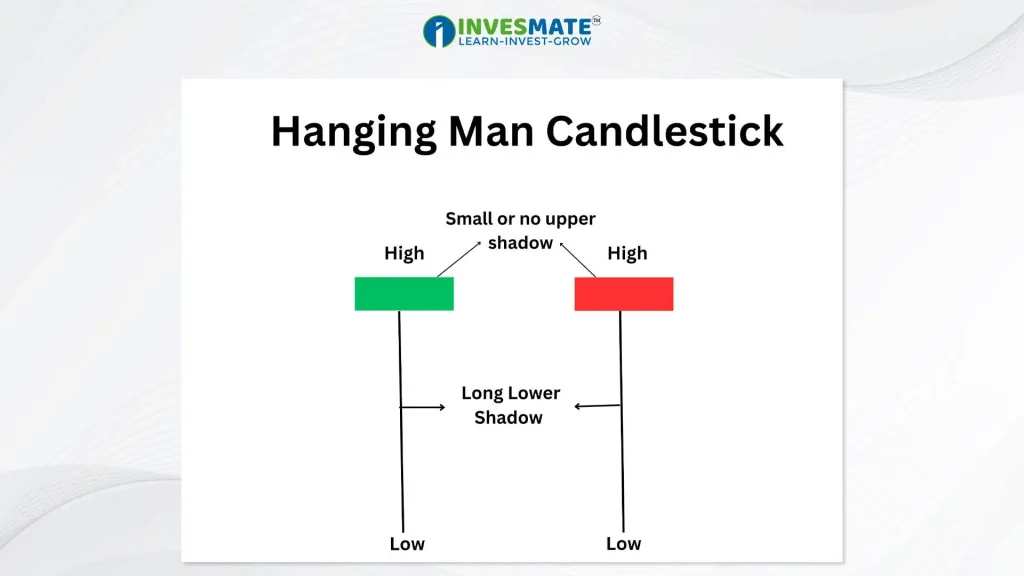
Hanging Man Candlestick Features :
Small body: Indicates minimal price movement.
Long lower shadow: Shows slight Selling pressure.
Short/no upper shadow: Suggests limited upward movement.
Volume: Higher volume strengthens pattern.
Location: More significant after strong uptrend, signalling potential reversal to bearish trend.
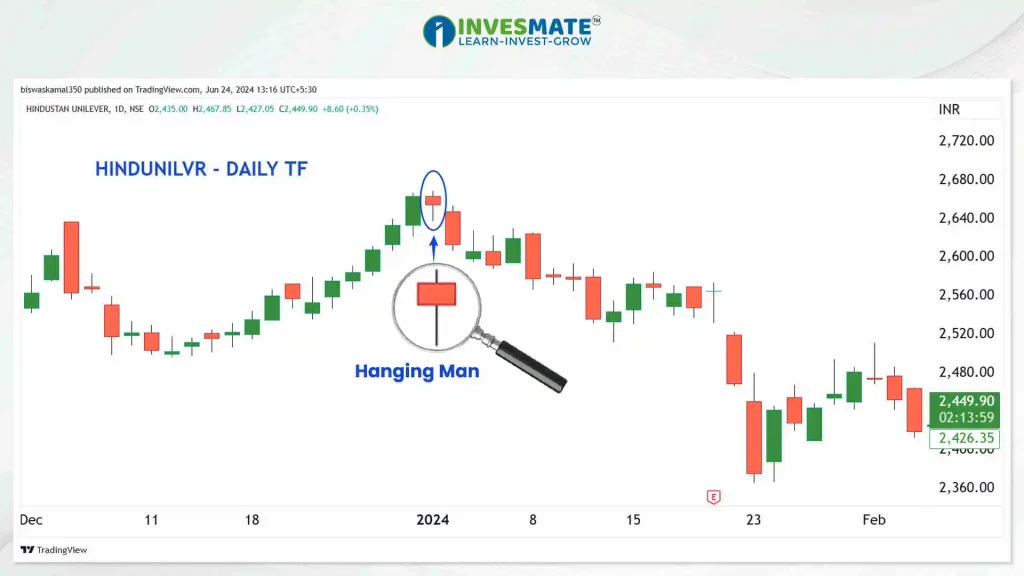
Here’s an illustration of how a Hanging Man Candlestick functions.
Interpreting single candlestick patterns involves analysing the candlestick’s body size, wicks, and position within the trend. Traders look for confirmation signals such as volume spikes, trendlines, or support and resistance levels to validate their interpretations and make well-informed trading decisions.
Application in Trading Strategies :
Single candlestick patterns can be incorporated into various trading strategies, including:
– Reversal Trading: Traders look for single candlestick patterns indicating potential trend reversals and enter positions accordingly.
– Continuation Trading: Single candlestick patterns can also signal continuity of the existing trend, providing opportunities for traders to ride the trend.
– Confirmation Signals: These patterns are often used in conjunction with other technical indicators or chart patterns to confirm trading signals and filter out false signals.
Conclusion :
Single candlestick patterns offer traders valuable insights into market sentiment and potential price movements within a specific timeframe. By understanding and effectively interpreting these patterns, traders can enhance their trading strategies and make more informed decisions. However, it’s essential to remember that no trading strategy is foolproof, and risk management should always be a top priority. Continual learning and practice are key to mastering the art of trading with single candlestick patterns.
FAQs
A single candlestick pattern, characterized by a candle’s unique shape and color on a chart, reveals market trends within a specific timeframe, indicating bullish, bearish, or neutral tendencies.
To read a single candle, analyze its body size, wicks (shadows), and color to determine market sentiment: a long body indicates strong movement, wicks show price rejection, and color indicates bullish (usually green) or bearish (usually red) sentiment.
Yes, a bullish hammer can be red.
A bullish candlestick pattern is one that signals a coming uptrend in an asset’s price or a continuation of said uptrend.
To confirm a candlestick pattern, look for supporting signals like volume spikes, trendline breaks, or nearby support and resistance levels.
Some of the most commonly recognized single candlestick patterns include:
- Doji
- Hammer
- Inverted Hammer
- Shooting Star
- Hanging Man
- Spinning Top
- Marubozu
এই তথ্য শুধুমাত্র শিক্ষামূলক উদ্দেশ্যে প্রদান করা হয়েছে। একে কোনোভাবেই Investment Advice বা Recommendation হিসেবে গণ্য করা উচিত নয়। আমরা একটি SEBI-registered Organization, এবং আমাদের মূল লক্ষ্য হলো বিনিয়োগ সম্পর্কিত Concepts-এর সাধারণ জ্ঞান ও বোঝাপড়া বৃদ্ধি করা।
প্রত্যেক পাঠক/দর্শককে অনুরোধ করা হচ্ছে, যেকোনো Investment Decision নেওয়ার আগে নিজস্ব Research এবং Analysis করুন। Investment সর্বদা হওয়া উচিত ব্যক্তিগত Conviction-এর ভিত্তিতে, অন্যের মতামত থেকে নয়। অতএব, প্রদত্ত তথ্যের ওপর ভিত্তি করে নেওয়া কোনো ধরনের Investment Decision-এর জন্য আমরা কোনোভাবেই Liability বা Responsibility গ্রহণ করি না।


Leave a Reply